This is a quick tip on rendering pgf plots inside RMD directly. You need to create a chunk like the following. The header of the chunk runs the tikz engine with the template option.
```{r,pgfplot, eval = TRUE, engine = "tikz", engine.opts = list(template="tikz2pdf.tex"), fig.cap="PGF plot rendered in RMD."}\begin{tikzpicture}
\begin{axis}
\addplot3[surf,domain=0:360,samples=40]
{sin(x)*sin(y)};
\end{axis}
\end{tikzpicture}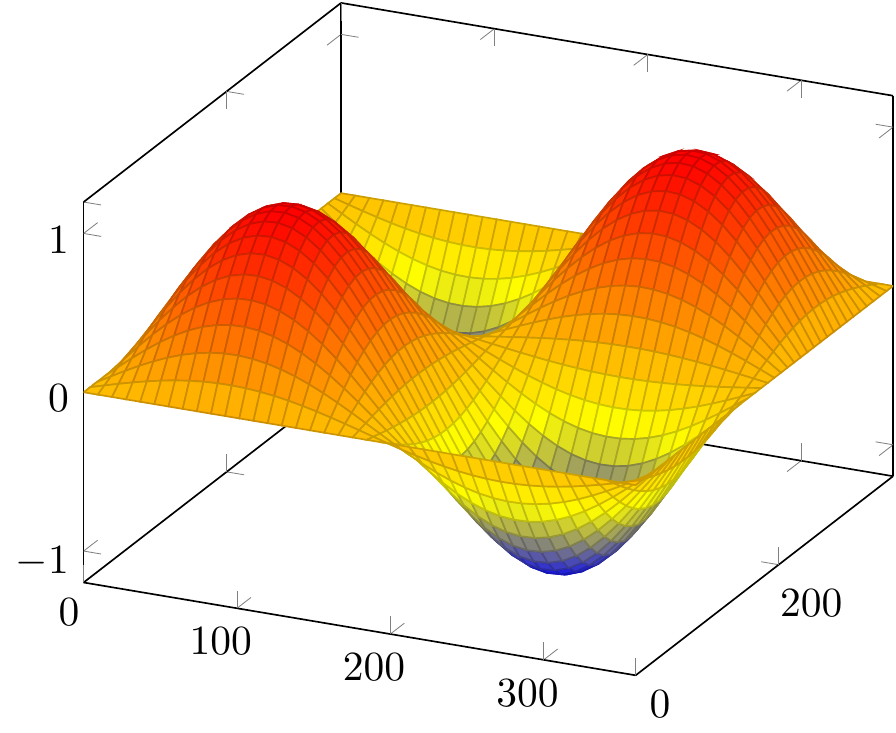
Figure 1: PGF plot rendered in RMD.
```
Figure 2: A screenshot of the chunk to avoid any confusion.
The template “tikz2pdf.tex” loads the relevant \(\LaTeX\) libraries. Ypu need to save it under the same directory as the RMD file or change the path accordingly.
\documentclass{article}
\usepackage{paralist,pst-func, pst-plot, pst-math, pstricks-add,tikz,pgfplots}
\usetikzlibrary{patterns,matrix,arrows}
\pgfplotsset{compat=1.16}
\usepgfplotslibrary{fillbetween}
\usetikzlibrary{patterns}
\usepackage[pdftex,active,tightpage]{preview}
\usepackage{amsmath}
\usetikzlibrary{matrix}
\begin{document}
\include{preview}
\begin{preview}
%% TIKZ_CODE %%
\end{preview}
\end{document}
And that’s it!